
Read the routing report
What the Auto routing report shows — where auto-routed requests went, what they saved against the strongest tier, how each tier, model and kind of work fared, and how often a follow-up corrected an answer — and how to act on it.
Every auto-routed request carries the router's decision. The routing report sums those decisions with each request's outcome: cost, errors, truncated answers and latency. It answers three questions:
- Is auto routing saving money?
- Is it sending work to models that can do it?
- Is the classifier healthy?
Where to find it
| Where | Who | Scope |
|---|---|---|
| Customer app › Analytics › Auto routing (Advanced view) | Anyone who can see Analytics | Your own requests, a team, or the organization. The audience switch works as on every other Analytics tab |
| Admin console › Models › Auto router › Routing quality | Platform administrators | All organizations, or one. The Usage analytics link opens the full report |
| API | See below | The same report as JSON |
The report covers up to 92 days and buckets its series by hour for windows up to three days, by day beyond. Where your audience can see individual requests, click a tier or a reason in the report to open Requests narrowed to it. The request detail then says why that request went where it did.
Totals
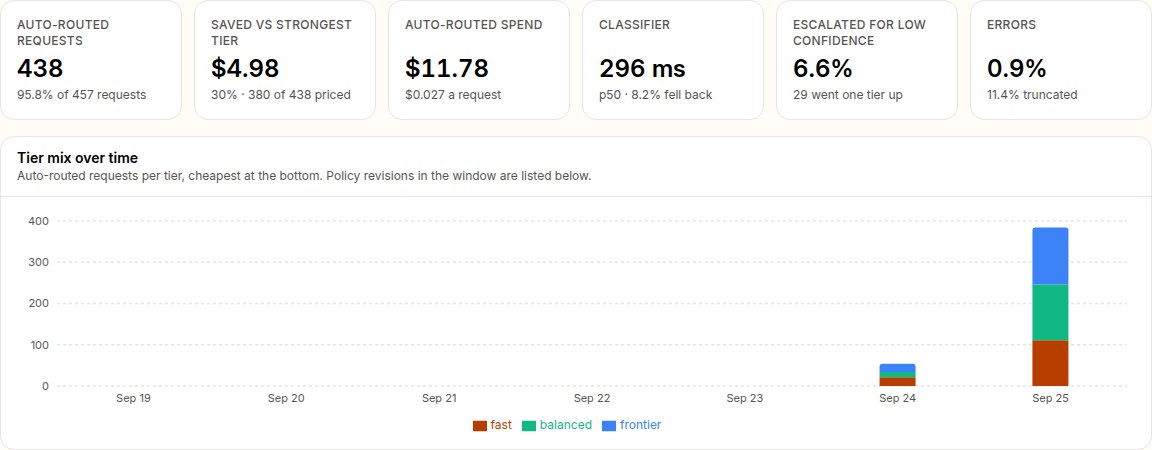
| Figure | What it says |
|---|---|
| Auto-routed requests | How many requests named tokamak/auto, and their share of all requests in the scope |
| Saved vs strongest tier | The strongest-tier cost minus what those requests actually cost, and the percentage saved. See How savings are computed |
| Auto-routed spend | What the auto-routed requests cost, and the cost per request |
| Classifier | The classifier's median latency, and how often it fell back because it failed |
| Escalated for low confidence | Requests sent one tier up because the classifier was unsure |
| Errors | The error rate, and how many answers were cut off by their output limit (truncated) |
Tier mix over time stacks requests per tier, cheapest at the bottom. A step in the mix often lines up with a policy revision, which the report lists at the end.
By tier and by model
Two tables, each with requests, share, spend, cost per request, savings, error and truncation rates, and median and 95th-percentile latency:
- By tier lists tiers cheapest first, with the classifier's mean confidence. Click a tier to list its requests.
- By model lists the models that served, busiest first. After the top 25, the rest are summed into one row.
Read them against each other. A cheap tier with a high error or truncation rate is doing work it should not get. A strong tier taking most requests means the savings are small; check whether its description is too broad.
By kind of work
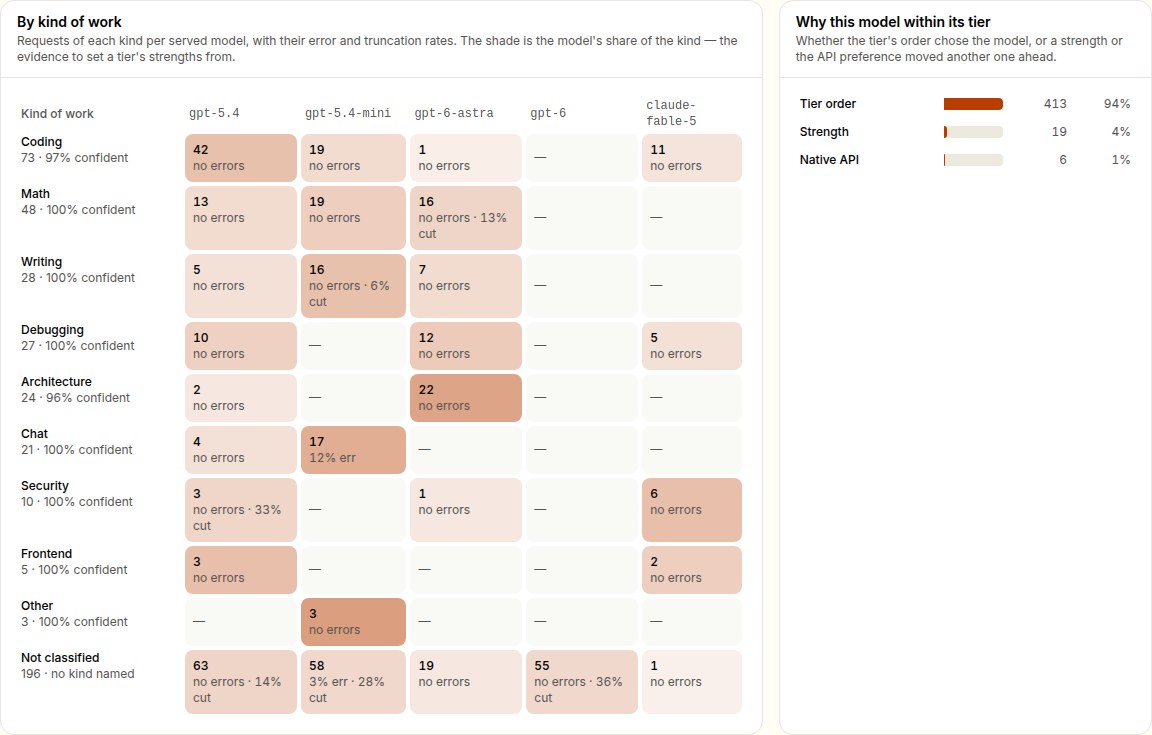
When the policy names kinds of work, each row is a kind and each column a served model:
- Each cell shows how many requests of that kind the model took, and their error and truncation rates.
- The shade is the model's share of the kind.
- Under each kind, the row says how often the classifier was confident enough for strengths to apply.
This table is the evidence for setting strengths. If one model of a tier takes a kind's requests with fewer errors or truncated answers than the other, mark it strong at that kind; see Configure › Kinds of work and strengths.
Why this model within its tier counts how the model was chosen inside its tier:
- Tier order: the tier's first servable model.
- Strength: a model strong at the request's kind went first.
- Native API: the API-family preference decided.
Follow-up turns
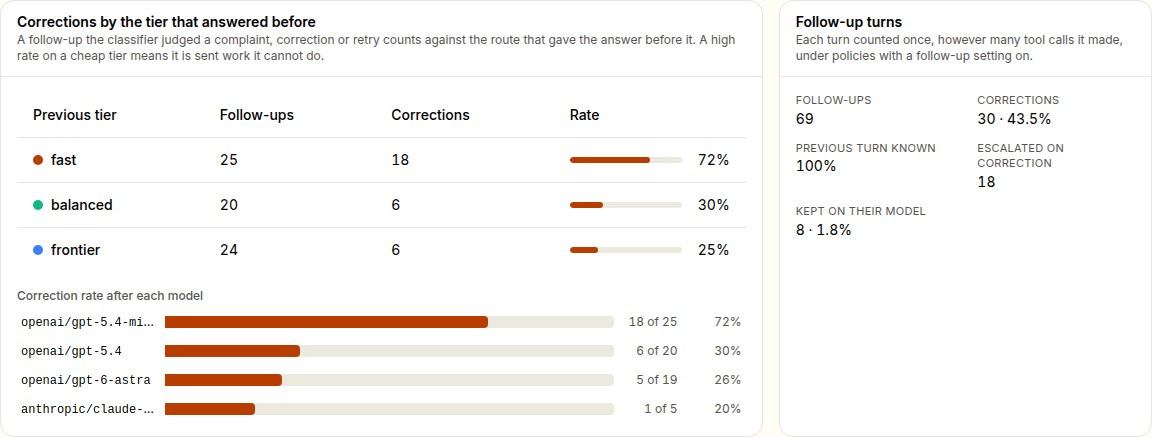
With either follow-up setting on, the classifier judges on every follow-up whether it corrects the previous answer. Each correction is charged to the route that gave that answer, not the one that served the complaint. Each turn counts once, however many tool calls it made.
- Corrections by the tier that answered before. Follow-ups, corrections and the correction rate after each tier, with the rate after each model below.
- A clearly higher rate after the cheapest tier is the signal of under-routing: that tier is being sent work it cannot do.
- A rate that is high everywhere is more likely the work itself, or the users.
- Follow-up turns:
- how many turns were follow-ups, and how many of them were corrections;
- how many had a remembered previous turn (each server remembers its own conversations, so a conversation spread across servers is remembered less);
- how many corrections were escalated;
- how many requests stayed on their model for its prompt cache.
- Latest corrections. The 20 most recent corrected follow-ups, each with the route that gave the answer, the route that served the correction, the kind of work and the classifier's probability. Those escalated by the policy are marked, and Show escalated corrections opens them in Requests. This list appears only where the report's audience can already see individual requests: your own requests, and the organization for its administrators. Team, member and platform views show the totals only.
Why requests went where they did
Reasons counts each decision reason:
- classified;
- escalated for low confidence;
- escalated on a correction;
- fallback after the classifier failed;
- no request text;
- not classified, for a token count;
- continuation.
Click a reason to list its requests. Reason codes are defined in How it works.
Classifier confidence is a histogram of how sure the classifier was of its tier. A lot of mass just below the confidence floor means many requests are paying for the next tier up. Below the histogram:
- the number of classifier calls and their input tokens;
- median and 95th-percentile latency;
- how often a turn reused an earlier answer;
- the classifier's cost at its catalog price.
Passed-over candidates lists the models requests skipped on the way to the one that served, and why:
- not servable;
- refused by an access policy;
- context window too small;
- the conversation is held by another provider.
A frequent refusal usually means the policy lists a model its users cannot reach.
Policy revisions in this window lists every policy version the requests were routed under, with when it was first and last used. A change of policy changes what the figures above measure.
How savings are computed
For every auto-routed request, the router names a baseline model. That is the model the request would have used had every request gone to the strongest tier: the request's own model if it was served there, otherwise the first model in the strongest tier the request could have used. That model must be active, allowed for the caller and large enough for the request. The usage record prices the request's own tokens at that model.
Saved is that baseline cost minus what the same requests actually cost. It is summed only over requests where both prices are known: the baseline's catalog price, and the request's own catalog price or, when billing charged it, its full charge. A request billing only observed (shadow mode) or whose charge was capped at its credit ceiling is left out, and so is a request your organization's own provider key served: its cost is your internal price, so counting it would report your discount as a routing saving. The savings figure says how many requests were counted.
It is a list-price estimate of the alternative, the same tokens on a stronger model. It is not what that model would have produced, and it does not include the classifier's own cost, which the classifier figures report separately.
Acting on it
| You see | Try |
|---|---|
| High correction rate after the cheapest tier | Narrow the fast tier's description, or switch on escalation on correction |
| Many low-confidence escalations | Make neighbouring tier descriptions more distinct |
| Classifier fallback rate above a few percent | Raise the classifier timeout; check the Jev provider |
| High error or truncation on one model | Move it later in its tier, or out of it |
| One model doing clearly better at a kind of work | Mark it strong at that kind |
| Savings on only some requests | Give the served and baseline models catalog prices |
| A frequent passed-over candidate | Fix its provider or access policy, or remove it |
API
The report is GET …/analytics/routing on every Analytics audience:
| Audience | Path |
|---|---|
| Your own requests | /v1/usage/me/analytics/routing |
| A team | /v1/usage/teams/{teamId}/analytics/routing |
| The organization, member view | /v1/usage/active-org/analytics/routing |
| The organization, administrator view | /v1/admin/active-org/usage/analytics/routing |
| The platform | /v1/admin/analytics/routing (one organization with organization_id) |
It accepts start_date, end_date, granularity=hour|day, and the audience's usual filters (model, provider, api_key_id, user_id, team_id, organization_id). Request listings accept:
routed=true: only auto-routed requests;route_tier: one tier;route_reason: one reason.
The response fields are listed in the Auto routing API reference.
Configure auto routing
Set up the policy behind tokamak/auto in the admin console. Choose tiers and models, the classifier, kinds of work and strengths, and follow-up settings, and try them before your users do.
Under the hood
The classifier behind tokamak/auto, the exact questions it is asked, the evaluations behind the defaults, what it costs, what leaves your deployment, and why the router works the way it does.